utu.spectrum.stem#
- utu.spectrum.stem(spectrum, ax=None, num_label=None, latex=False, headroom=1.45, axis='line', kwargs_line=None, kwargs_text=None, kwargs_adjust=None)[source]#
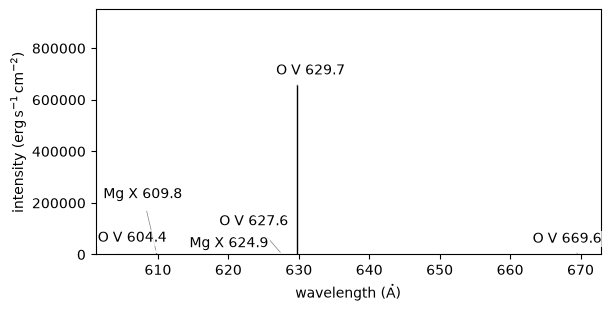
Draw a spectrum as a stem from zero for each line, and label the brightest of them with the ion which emitted them.
A spectrum of lines is mostly empty, and what matters about it is which line is where and how much brighter it is than its neighbours. Drawn this way it is the picture an instrument is designed against.
The labels are moved apart so that none covers another or crosses a line it does not belong to. Each line is handed to the solver as points along its length rather than as a point at its tip, more of them for a brighter line, which is what keeps a label from being pushed across one.
- Parameters:
spectrum (FunctionArray) – The lines to draw, as
lines()returns them: a wavelength and an ion for each line, and its intensity. Every line given is drawn, so slice it first to draw fewer.ax (None | Axes) – The axes to draw on. If
None(the default), the current axes.num_label (None | int) – How many of the brightest lines to label. If
None(the default), all of them are labelled.latex (bool) – Whether to set the name of each ion in LaTeX, which needs the axes to be rendering text through LaTeX to come out right.
headroom (float) – How much taller than the brightest line to make the axes, so that the labels have somewhere to be pushed into.
axis (str) – The name of the axis along the lines of
spectrum.kwargs_line (None | dict) – Additional arguments passed to
matplotlib.axes.Axes.vlines().kwargs_text (None | dict) – Additional arguments passed to
matplotlib.axes.Axes.text().kwargs_adjust (None | dict) – Additional arguments passed to
adjustText.adjust_text().
- Return type:
The label of each line that was labelled, in the order they were drawn.
Examples
The brightest lines of two ions, from a plasma spread evenly over a decade of temperature.
import astropy.units as u
import matplotlib.pyplot as plt
import named_arrays as na
import utu

temperature = na.geomspace(1e5, 1e6, axis="temperature", num=11) * u.K

result = utu.spectrum.lines(
    temperature=temperature,
    density=1e15 * u.K / u.cm ** 3 / temperature,
    emission_measure=1e27 / u.cm ** 5,
    wavelength_min=550 * u.AA,
    wavelength_max=680 * u.AA,
    ions=["O 5", "Mg 10"],
)

fig, ax = plt.subplots(figsize=(6, 3), constrained_layout=True)
utu.spectrum.stem(result[{"line": slice(6)}], ax=ax)
ax.set_xlabel(f"wavelength ({u.AA:latex_inline})")
ax.set_ylabel(f"intensity ({result.outputs.unit:latex_inline})");