utu.spectrum.contribution_function#
- utu.spectrum.contribution_function(ion, density, axis_temperature, axis='line', proton_electron_ratio=None)[source]#
Compute the contribution function of every line of an ion.
Returned as a function of wavelength, so that a line and its strength cannot come apart. They are separate arrays underneath, of different lengths whenever an ion has a two-photon transition, and pairing them by hand is a way to label every line with its neighbor’s wavelength.
Whether the temperatures and the densities are taken in pairs or as a grid is decided by their axes. A density which shares the axis of the temperature describes one density per temperature, an isobaric atmosphere for instance, and is computed as such. A density on an axis of its own describes every density at every temperature, and costs as many times more.
- Parameters:
ion (Ion) – The ion to compute the contribution function of.
density (Quantity | AbstractScalar) – The number density of electrons.
axis_temperature (str) – The name of the axis of the temperature of
ion.axis (str) – The name to give the axis along the lines of the result.
proton_electron_ratio (None | Quantity | AbstractScalar) – The ratio of protons to electrons at each temperature of
ion. IfNone(the default),fiascocomputes it, which walks the whole database and takes an order of magnitude longer than the rest of this function put together. It depends on the temperature and on nothing else, so a caller with more than one ion should compute it once withfiasco.proton_electron_ratio()and pass it here. Doing so primes the cache ofionwith the value it would otherwise have computed for itself.
- Return type:
Examples
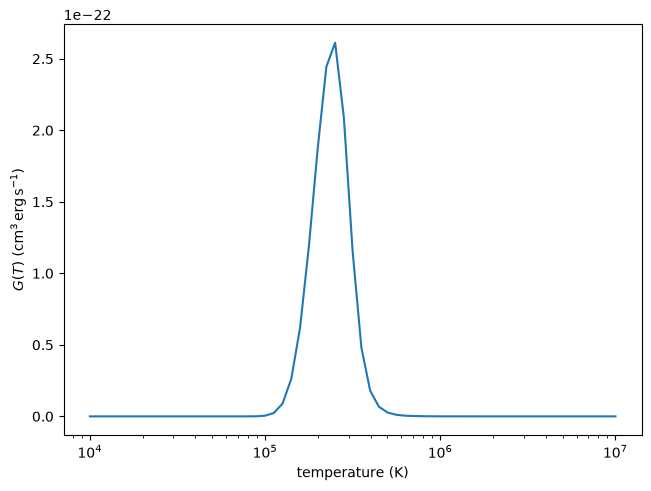
The contribution function of the line ESIS was built to observe, which peaks at the temperature the line is formed at.
import astropy.units as u
import fiasco
import matplotlib.pyplot as plt
import named_arrays as na
import numpy as np
import utu

axis = "temperature"
temperature = na.geomspace(1e4, 1e7, axis=axis, num=61) * u.K

ion = fiasco.Ion("O 5", temperature.ndarray)

result = utu.spectrum.contribution_function(
    ion=ion,
    density=1e15 * u.K / u.cm ** 3 / temperature,
    axis_temperature=axis,
)

# the strongest line of the ion, at 629.7 angstroms
index = np.argmax(result.outputs.max(axis), axis="line")

fig, ax = plt.subplots(constrained_layout=True)
na.plt.plot(
    temperature,
    result.outputs[index],
    ax=ax,
    axis=axis,
)
ax.set_xscale("log")
ax.set_xlabel(f"temperature ({temperature.unit:latex_inline})")
ax.set_ylabel(f"$G(T)$ ({result.outputs.unit:latex_inline})")
Text(0, 0.5, '$G(T)$ ($\\mathrm{cm^{3}\\,erg\\,s^{-1}}$)')